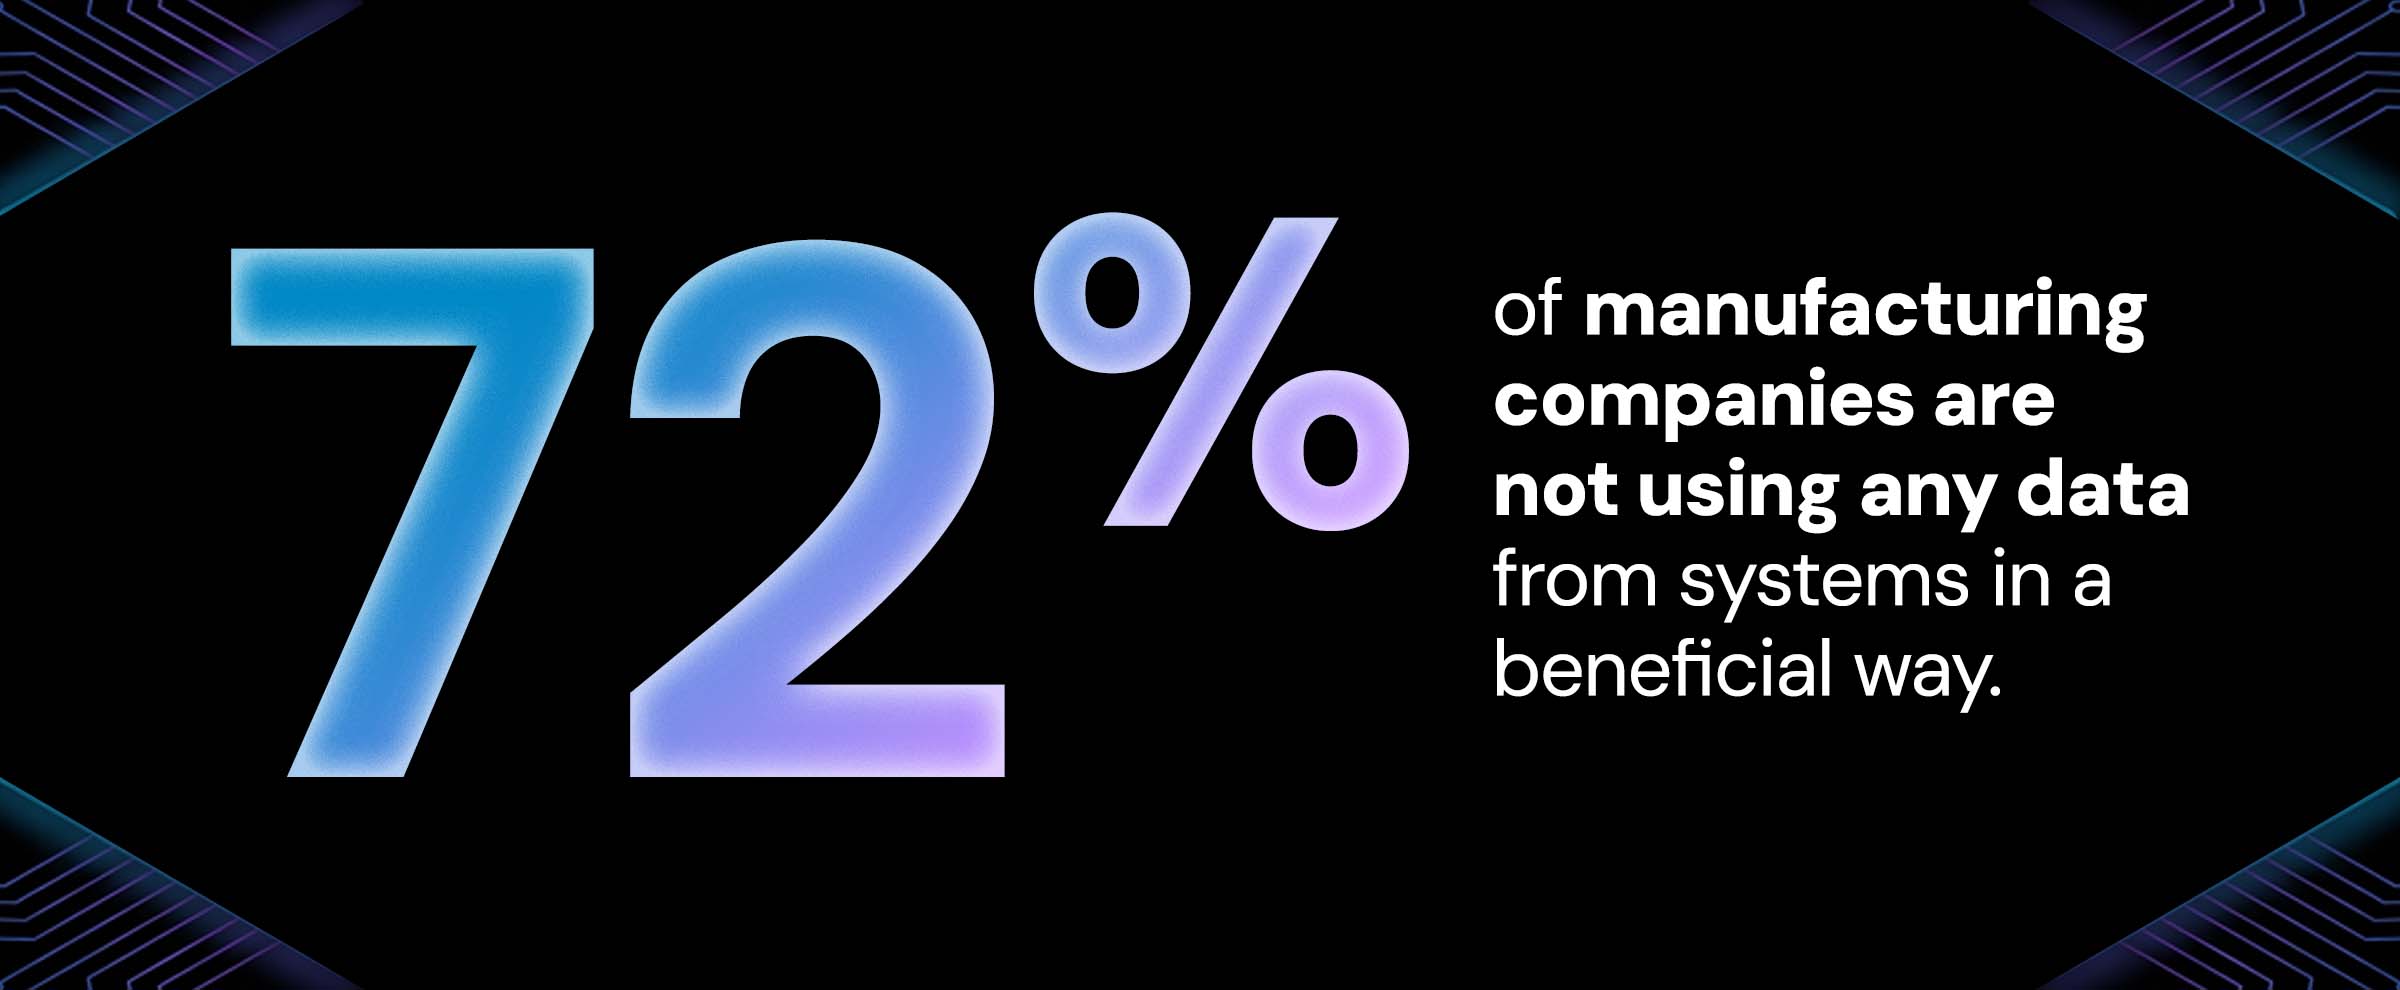
In an industry with razor thin margins, you need to leverage every asset you have. Yet across the manufacturing industry, companies are leaving a powerful opportunity on the table: their data. According to research from IBM, 72% of manufacturing companies are not using any data from equipment or systems in a beneficial way. When your operational challenges include $260,000-an-hour downtime and supply chains that disrupt every 3.7 years, it might be time to find a way to utilize 100% of what you do have control over. Let’s put that unused data to work and gain the edge over your competitors you’ve been waiting for.
Manufacturing’s economics demand better intelligence.
Net profit margins for the average U.S. manufacturer sit around 8% (ProjectionHub analysis of industry financials), with auto manufacturing as low as ~12% gross margin(Vena Solutions). Downtime is the single biggest profit leak — and it is getting worse, not better. The Siemens True Cost of Downtime 2024 report (with Senseye) calculates that the world’s 500 largest industrial companies lose roughly $1.4 trillion per year — 11% of revenue — to unplanned downtime, with the average large plant losing $253 million annually. Per-hour costs run $36,000 in fast-moving consumer goods at the low end and $2.3 million per hour in automotive — “more than $600 a second,” in Siemens’ words. Aberdeen Research and ABB’s Value of Reliability survey of 3,200 plant maintenance leaders peg the cross-sector average at roughly $125,000–$260,000 per hour, with two-thirds of plants suffering at least one unplanned downtime event a month. While you can’t control the margin pressure or every disruption, what you can control is whether you’re making decisions with complete information — or leaving the data that could give you an edge sitting unused.
Manufacturers are sitting on enormous unused data.
As mentioned earlier, IBM’s study found that only 28% of manufacturing organizations are using data from equipment, processes, and systems to draw insights for continuous process improvement, and fewer than 1 in 5 have real-time access to important manufacturing data across the enterprise. And companies are still reacting slowly, leaving this opportunity wide open for competitors. According to Deloitte and the Manufacturing Leadership Council , “only 51.6% of manufacturers indicated that they have a corporate AI strategy.” But the value is there for the taking and it has a real number associated to it; according to BCG’s June 2025 analysis of AI in manufacturing, there is an opportunity to drive more than 30% productivity gains in industrial operations.
What is AI-Powered Manufacturing Business Intelligence?
Traditional manufacturing BI is a dashboard. You hire an analyst (or buy a seat in Power BI, Tableau, or Domo), they connect to your ERP and maybe your MES, and every Monday morning you get a report telling you what already happened: scrap by line, OEE by shift, on-time delivery by customer. AI-powered manufacturing business intelligence is fundamentally the same at its core in terms of metrics; but the way the data is present and the labor involved is fundamentally different. It employs large language models or machine learning to analyze that data, rather than just present it. Instead of requiring a human to take the data from the BI and analyze it, AI can take that same data, analyze, and turn it into answers instantly.
A traditional BI example, manufacturing edition: A plant manager opens Monday’s dashboard. Line 3 had 14% scrap last week, up from a 6% baseline. The dashboard tells him what happened. Now he assigns a quality engineer to spend three days pulling reports from the QMS, cross-referencing operator schedules in the HRIS, checking raw material lots in the ERP, and hunting through the MES for cycle-time anomalies. By Thursday he has a hypothesis.
The AI-powered BI version: The same plant manager types: “Why did Line 3 scrap spike last week?” Within seconds the system has cross-referenced the MES (Line 3 ran 8% above takt time on Tuesday and Wednesday), the QMS (failure mode shifted from dimensional to surface defects), the ERP (raw material lot RM-44219 from Supplier B was introduced Tuesday morning), and operator schedules (a new operator was on second shift both days). The AI doesn’t just tell him what — it tells him the most statistically likely why, ranks the contributing factors, and suggests where to investigate first. That is the difference between descriptive analytics and AI-powered, cross-system, decision-ready intelligence.
Critical Benefits for Manufacturers
Optimizing sales capacity and revenue forecasting
McKinsey’s research shows AI-driven demand forecasting improves forecasting accuracy by 10-20%, translating into revenue increases of 2-3%. For manufacturers, that accuracy gap often hides in plain sight inside systems they already use.
Cross-system example: A mid-sized contract manufacturer uses HubSpot to manage their sales pipeline and QuickBooks for invoicing and job costing. Separately, neither system tells the full story. AI connects them and surfaces: “You have $340,000 in deals at the proposal stage with an average close rate of 38% and a 45-day sales cycle — but your QuickBooks job history shows you’re currently at 94% capacity through the next 60 days. Three of these deals, if they close on their expected timeline, will overlap with your highest-margin recurring contracts. Recommend prioritizing Deal A and Deal C, which have later start dates, and flagging Deal B for a delayed start negotiation before it’s won.” Sales pipeline visibility + actual capacity from job costing — one answer, no spreadsheets.
Cutting costs by finding margin leaks across customers and jobs
Most manufacturers look at revenue to rank their best customers — without factoring in service costs, payment behavior, and job complexity.
Cross-system example: A specialty fabricator has 40 active customers. QuickBooks shows their top 5 by revenue. But when AI cross-references QuickBooks job costs, invoice aging, and HubSpot interaction history, the picture changes: “Customer B — your #2 by revenue at $480,000 annually — has an average invoice payment of 47 days, required 3 change orders per job over the last 12 months, and your HubSpot activity log shows 4.2x more sales and support touchpoints than your average customer. Actual margin after time cost: 11%. Customer F, ranked #9 by revenue at $210,000, pays in 12 days, averages 0.4 change orders, and requires minimal account management. Actual margin: 34%.” You already have both datasets. Without AI connecting them, Customer B looks like a win.

Real-World Impact: What Manufacturers Discover
When manufacturers connect their financial and customer data to AI, here are three things likely to surface:
The “real” cost driver is rarely what management thinks it is. The owner swears the problem is slow months. The sales manager points to a competitor undercutting on price. But when AI cross-references QuickBooks job costs with HubSpot customer data, the answer is usually more specific: one or two customers are generating 40% of revenue but 70% of your team’s time, paying late, and buying at margins that don’t justify the relationship. The highest-value insight isn’t always about production — it’s about which business you’re actually in.
Your most visible revenue isn’t your most profitable revenue. Without AI connecting your accounting and CRM data, you rank customers by what they pay you. With it, you rank them by what they actually cost you to service — factoring in payment terms, change order frequency, sales cycle length, and support touchpoints. Manufacturers who run this analysis for the first time might discover their top 3 customers by revenue aren’t in their top 5 by margin. That changes every conversation about where to focus growth.
The data to fix your biggest problems already exists — it’s just sitting in systems that don’t talk to each other. Your QuickBooks history contains years of job cost patterns. Your HubSpot holds every customer interaction, deal cycle, and lost opportunity. Separately, neither tells you much. Together, they answer the questions you’ve been guessing at: which job types are consistently underpriced, which customers cost more to keep than they’re worth, and where your growth is actually coming from. ROAI connects those systems and surfaces those answers — without a data analyst, without a spreadsheet, and without waiting until the end of the quarter to find out.
Common Objections (And Why They’re Wrong)
“We’re too small. AI is for the auto OEMs.”
Cloud-based BI platforms make AI-powered analytics available at SMB price points — typical predictive-maintenance pilots now run under $50,000 and pay back inside 12–24 months. Siemens’ True Cost of Downtime report explicitly notes downtime costs SMEs $150,000+ per hour at the high end and that the falling cost of Industry 4.0 technology gives SMBs a “unique opportunity” to leapfrog.
“Our data isn’t clean enough.”
McKinsey’s COO survey found 46% of manufacturers cite limitations in data or IT/OT systems as their top scaling challenge — but the answer is not to perfect your data first. The right AI BI layer normalizes, contextualizes, and queries data across imperfect systems. Start with the use case, fix data quality where it actually matters.
“Our people will resist.”
McKinsey’s research shows that “two of the three biggest challenges in implementing AI in operations relate to people” — culture (50%) and reskilling (almost 50%). True. The fix is not to skip AI; it’s to deploy AI in ways that visibly help operators and supervisors instead of threatening them. A natural-language BI interface that lets a shift supervisor ask “why did Line 2 miss last night?” without writing SQL is an asset to the workforce, not a replacement for it.
“We already have a BI dashboard.” A dashboard tells you what happened. AI-powered intelligence tells you why it happened, what’s likely to happen next, and what to do about it — across systems, in plain English, in seconds. They are not the same product.
See What AI Discovers About Your Business
Reading about AI capabilities is one thing. Seeing your own business data transformed into actionable insights is another.
That’s why we built ROAI —an AI platform designed specifically for small and medium-sized businesses. We integrate with Hubspot, Quickbooks, Gmail, Outlook, Shopify, Stripe, Google Drive, Odoo, Paypal, Sharepoint and Woocommerce.
Here’s what you get:
- Simple integrations – Connect in under 60 seconds
- Automatic daily insights – Wake up to a dashboard showing what matters
- Plain-English questions – “Show me my most profitable customer”
- Cash flow forecasting – Know what’s coming 30-90 days ahead
Connect your data and see what real insights AI discovers about your business.
A note on sources
- The statistics in this article reflect what is achievable with disciplined execution, not guaranteed outcomes for every manufacturer. McKinsey’s 2025 COO survey notes only 2% of manufacturers have fully embedded AI across operations, and Deloitte’s research found 91% of AI projects in some markets failed to meet expectations. Results depend heavily on data quality, implementation approach, and organizational buy-in.
- Some widely cited statistics have limitations worth noting. The IBM figure citing 72% of manufacturers as not meaningfully using operational data originates from IBM’s Institute for Business Value Manufacturing 4.0 study and has been broadly republished across industry literature — it remains a widely accepted directional benchmark. The Aberdeen $260,000/hour downtime figure is a cross-sector average; a small job shop may lose far less per hour, while an automotive plant may lose far more. Use your own calculation as the more relevant number.
- The cross-system examples in this article — connecting HubSpot pipeline data with QuickBooks job costing — are illustrative scenarios designed to show the type of insight AI-powered BI can surface. Actual results will vary based on the volume and quality of data in your specific systems.
- Finally, not all AI BI platforms are equal. When evaluating options, ask vendors to point to named primary research rather than anonymized case studies, and start with a single use case tied to a specific P&L line item before expanding.